
Technical analysis is the study of past price history, to determine the future direction of a currency pair. Traders who use technical analysis generally believe that all the current available information that exists is incorporated into the current value of an assets. By evaluating the past, you can determine where traders believe the market will move in the future. Traders will often use support and resistance levels, patterns and statistical tools as part of their technical analysis arsenal.
Support levels are levels that represent demand. When a price of a currency pair reaches support levels it generally has a difficult time moving below it. Support can be generated by using trend lines or moving averages. Resistance is a level that represents supply. When the price of a currency pair reaches resistance levels it generally has a difficult time moving above it. Support can be formulated using trend lines or moving averages.
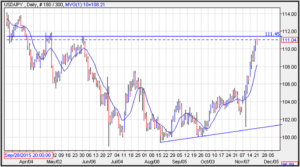
Many traders use horizontal trend lines as support or resistance levels. The USD/JPY chart shows and example of a horizontal trend line that represents the highs in May of 2016. This level if breached will be a break of resistance which is generally seen as a catalyst for a breakout.
Connecting trend lines create a slope which is used to determine support and resistance levels. Generally, upward sloping trend line are used for support while downward sloping trend lines are used for resistance. The chart of the USD/JPY shows an upward sloping trend line that could be used for support. The trend line connected the lows in August to the lows in September and generated a trend line that seemed to how when the USD/JPY tumbled in early November.
Another type of support and resistance technique is to use a moving average. A moving average is the average of a specific number of days. In the chart of the USD/JPY the moving average is a 10-day moving average. The average is calculated for 10-days and on the 11th day the first day of the moving average is removed from the calculation. The moving average can be charted and viewed on a graph like trend lines. A moving average can be used as both support and resistance levels and when the price of an asset falls below support it can be looked at as a breakdown.
Support and resistance levels can be used for entry and risk management. Many times, you might have considered entering a trade when the exchange rate of a currency pair breaks through a trend line. You could then find target support levels that would act as your take profit level. For example, if the USD/JPY closed above the horizontal trend line at 111.45, you might have considered taking profit at target resistance near the next horizontal trend line at 111.90.
Another technique might be to purchase the currency pair when the exchange rate falls to support near the 10-day moving average. You could then use the target resistance of the horizontal trend line as your take profit level.
Support and resistance are the cornerstones of technical analysis. They profit levels where you might consider entering a trade as well as levels that provide the backdrop for your risk management. Technical analysis is the study of past price action as many traders believe that all the available information is already incorporated into the exchange rate of a currency pair.
Leave a Reply