
Forex signals are made possible by the use of certain indicators which allow a real time analysis of price action. Apart from fundamentalists, most of the traders and FOREX Brokers use these indicators to predict future prices. The indicators offer a simple method of recognizing patterns and forecasting which way the price will trend next.
One of the leading indicators used by analysts – Divergence, helps to significantly increase profits. It is a concept developed by Charles Dow and mentioned in his book Dow Tenets. Just by the name of the indicator it can be easily understood that divergence is a type of trading deviation. The actual price and the indicators are supposed to be in complete harmony by increasing or decreasing in the same direction and at equal rates. When the price and indicators don’t correlate it can be said that there is going to be a change. Divergence is calculated between highs and lows of the price and the indicators. When used with other Forex trading strategies, it can give your chart analysis and trading skills the push they need to make you a sound and solvent trader. The top indicators for trading divergence are RSI, MACD, Volumes and Stochastic.
Divergence is either bullish or bearish depending on the change of indicator in reference to the change of price. There are 4 types of divergences:
- Bullish Divergence
- Hidden Bullish Divergence
- Bearish divergence
- Hidden Bearish divergence
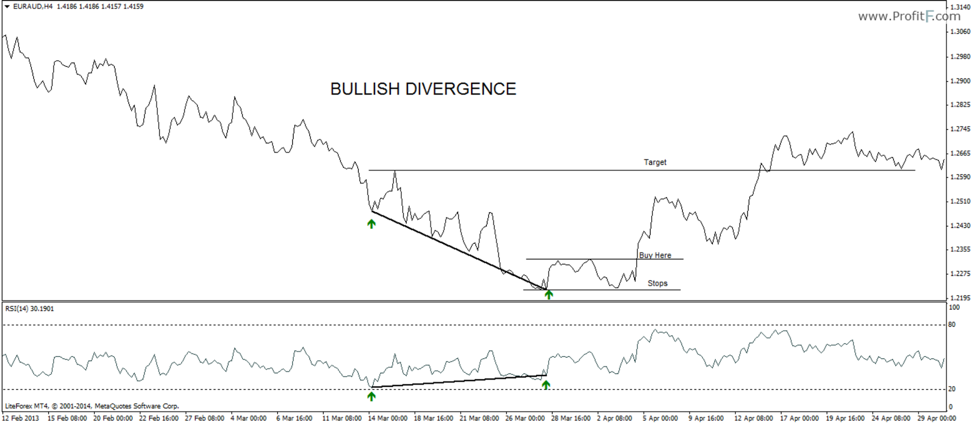
The chart above shows the price making a lower low while the RSI makes a higher low. In this situation a long position may be entered at the top of the bounce after the 2nd low is made with stops at or below the 2nd low with target to the high formed during the divergence.
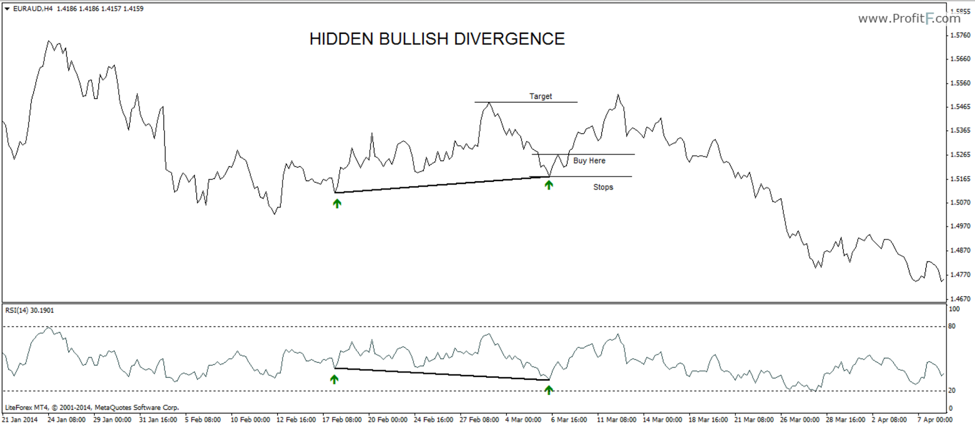
In the above chart hidden bullish is shown where the price makes a higher low, while the indicator makes a lower low. Buying on the break of the previous minor rally with stops by or below the 2nd low of price offers a rewarding trade which targets the previous high that was formed.
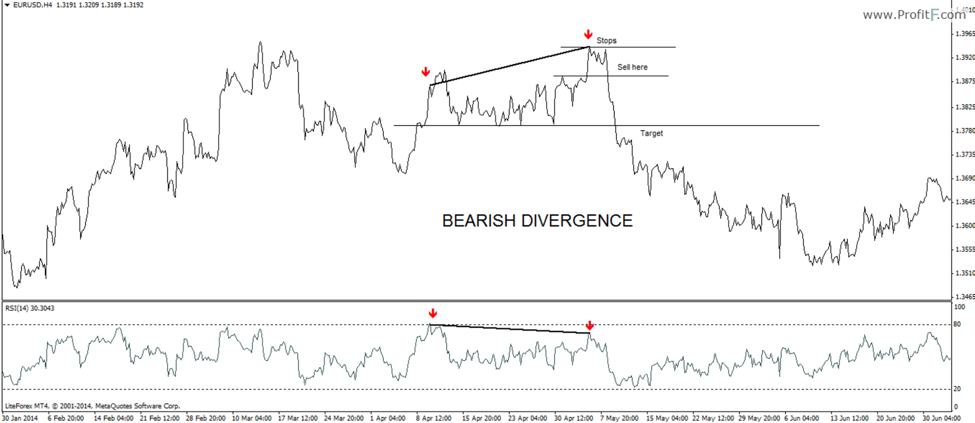
In the above chart bearish divergence is shown with the price making a higher high but the RSI is making a lower high. A sell position forms at the small resistance prior to the high with stops at recent high targeting, the low formed during divergence shows a high probability of trade potential.
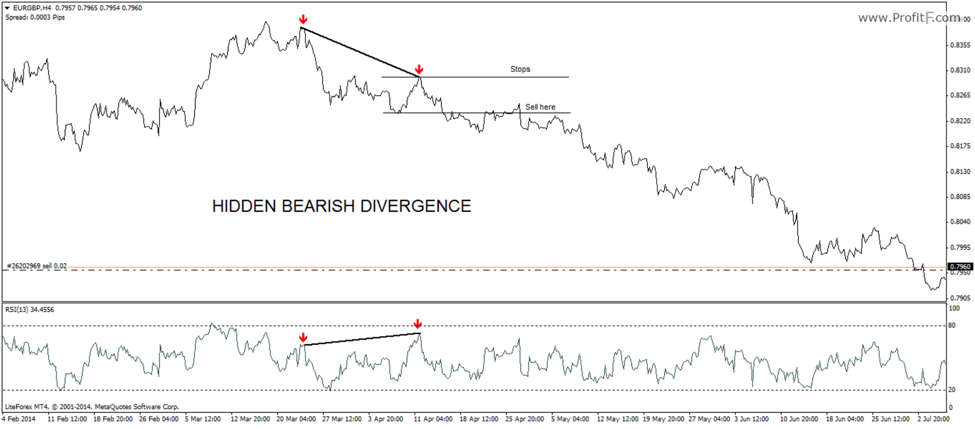
The chart above shows bearish divergence as price makes a lower high and RSI makes a higher high. The divergence occurs in a downtrend and signals continuation. Hence, short positions may be taken on the low formed during divergence to trade in the direction of the trend.
Divergence trading is simple and can easily be traded on any time frame. Line chart is the best method when using divergence specially when RSI is used it gets easier to spot divergences.
Leave a Reply