
Forex price action trading is often a rather broad term used to depict trading with the naked charts, devoid of any indicators. It encapsulates both candlestick patterns as well as chart patterns. While there are many articles written about forex price action trading and the subsequent trading strategies based off this approach, when applying the same to the real markets, it is often a different story. For one, the occurrence of a near textbook chart patterns are very rare and secondly there are a lot more variables to consider as well. A simple example that illustrates this point is to open any chart and look for candlestick patterns. Chances are that in most cases, price often ends up going in the opposite direction than intended.
For traders who have been using forex price action and have had little success to talk about, these five forex price action trading tips can be of great help.
1. Not all candlestick patterns are created equal
Let’s start with the most basics of price action trading, which is candlestick pattern. While there are nearly 20, if not more candlestick patterns, traders fail to realize that not all candlestick patterns are the same. For example, a single candlestick pattern such as a doji or a hammer is less efficient compared to a two candlestick pattern such as a bullish or bearish engulfing or a harami pattern. Understanding this helps traders to eliminate the common mistakes.
2. Candlestick patterns at support/resistance levels are the ones that matter
Although this might sound a bit contrary to what was pointed out in the first tip, candlestick patterns that occur near an identified support or resistance levels tend to carry a lot more weight and validity. For example, when price breaks a resistance level and then falls back to retest it for support and in the process forms a bullish engulfing pattern, this kind of candlestick patterns tend to be more valid. The same is illustrated in the chart below.
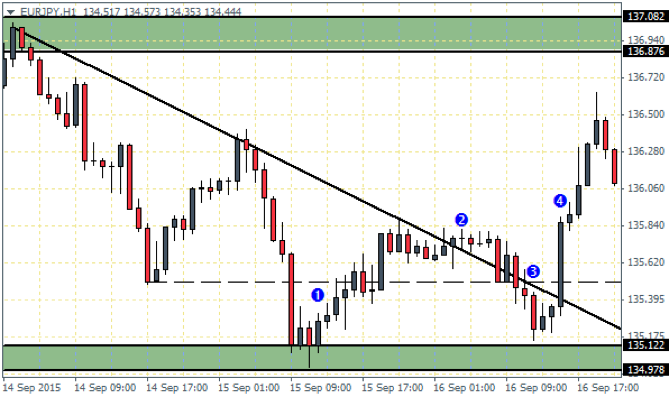
In the above chart, we have identified some key patterns on the chart, described in detail below.
- Price forms a bullish engulfing candlestick pattern at an identified support level. As seen on the charts, such kind of candlestick patterns at a support or resistance levels are more valid and thus need to be traded with the context
- After connecting the falling trend line, we notice a breakout and then a Doji candlestick. Notice how price promptly falls back below the trend line? A trader who would have simply taken a long position would no doubt end up with a losing trade and thus conclude that forex price action doesn’t work
- The marker at 3 shows the minor support level being broken. However, prices fail to establish contact near the support level
- At point 4, the breakout occurs with a strong bullish candlestick which breaks the support as well as the trend line. Taking this into context from the above 3 points, taking a long position on the close of the bullish candlestick targeting the previously identified resistance level would have offered a great risk/reward trade set up
3. Never used a 100% target measured move for chart patterns
Most articles on chart patterns often tell you to set the target on a chart pattern at 100% of the measured move. Meaning, if you notice a head and shoulders pattern, according to most textbook articles, your take profit level should be set to the 100% of the distance from the head to the neckline, projected off the neckline downwards. While such examples might look great in hindsight, when you are trading the live markets, prices barely traverse down the entire 100% measured move distance. You are better off using the 127.2% and the 161.8% moves (27.2% and 61.8% off the 100% move). The chart below illustrates this point.
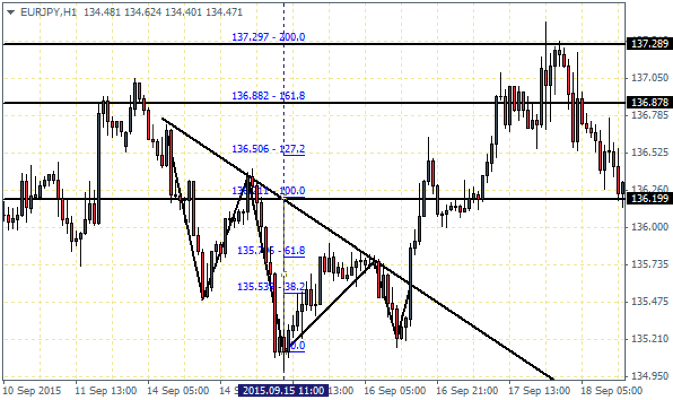
- In the above chart, the inverse head and shoulders pattern was identified and using the Fib tool, we project the 127.2%, 161.8% and 200% of the measured move
- Textbook articles often tell us to set the target to 200%. While that may be true, notice how price quickly consolidated near the 200% level and then saw a sharp reversal?
- Instead of setting the target to 200%, if a trader would have booked profits at 127.2% and 161.8%, by the time price reached 200%, the trader would have already made a decent profit off the projected move.
4. Always have the bigger picture in mind
With forex price action trading, it is more sensible that a trader spends time to get a more clear understanding of the market including the bigger picture. This means a trader needs to look at the monthly, weekly, daily charts to get an idea of what the market is doing and then identify the trends and also plot potential support/resistance levels. Once the big picture is formed, the trader can then zoom into a lower time frame such as H1 or H4 and trade off these smaller time frame charts. Profits can be further managed by constantly looking back into the larger time frames (for example if you trade off an H4 chart, then once your trade is in play, look to the daily and weekly or monthly charts when a new session is formed in order to understand how price action is evolving).
5. Never delete old charts
A common mistake traders make is by deleting old charts. The ones where they spent a lot of time to understand the market sentiment of where they think there are too many support/resistance levels printed on the chart. While it may look cluttered, traders should remember that past support/resistance levels play an important role and, therefore, traders should always have these charts that they can fall back on.
The above five points are something which is tried and tested by professional traders but often not talked about much. If there’s one obvious takeaway from the above 5 points in forex price action trading, then it is the fact that traders need to be ‘aware’ of the markets and what they are doing and at the same time, exhibit patience and wait for the right conditions or set ups before entering the market.
Leave a Reply